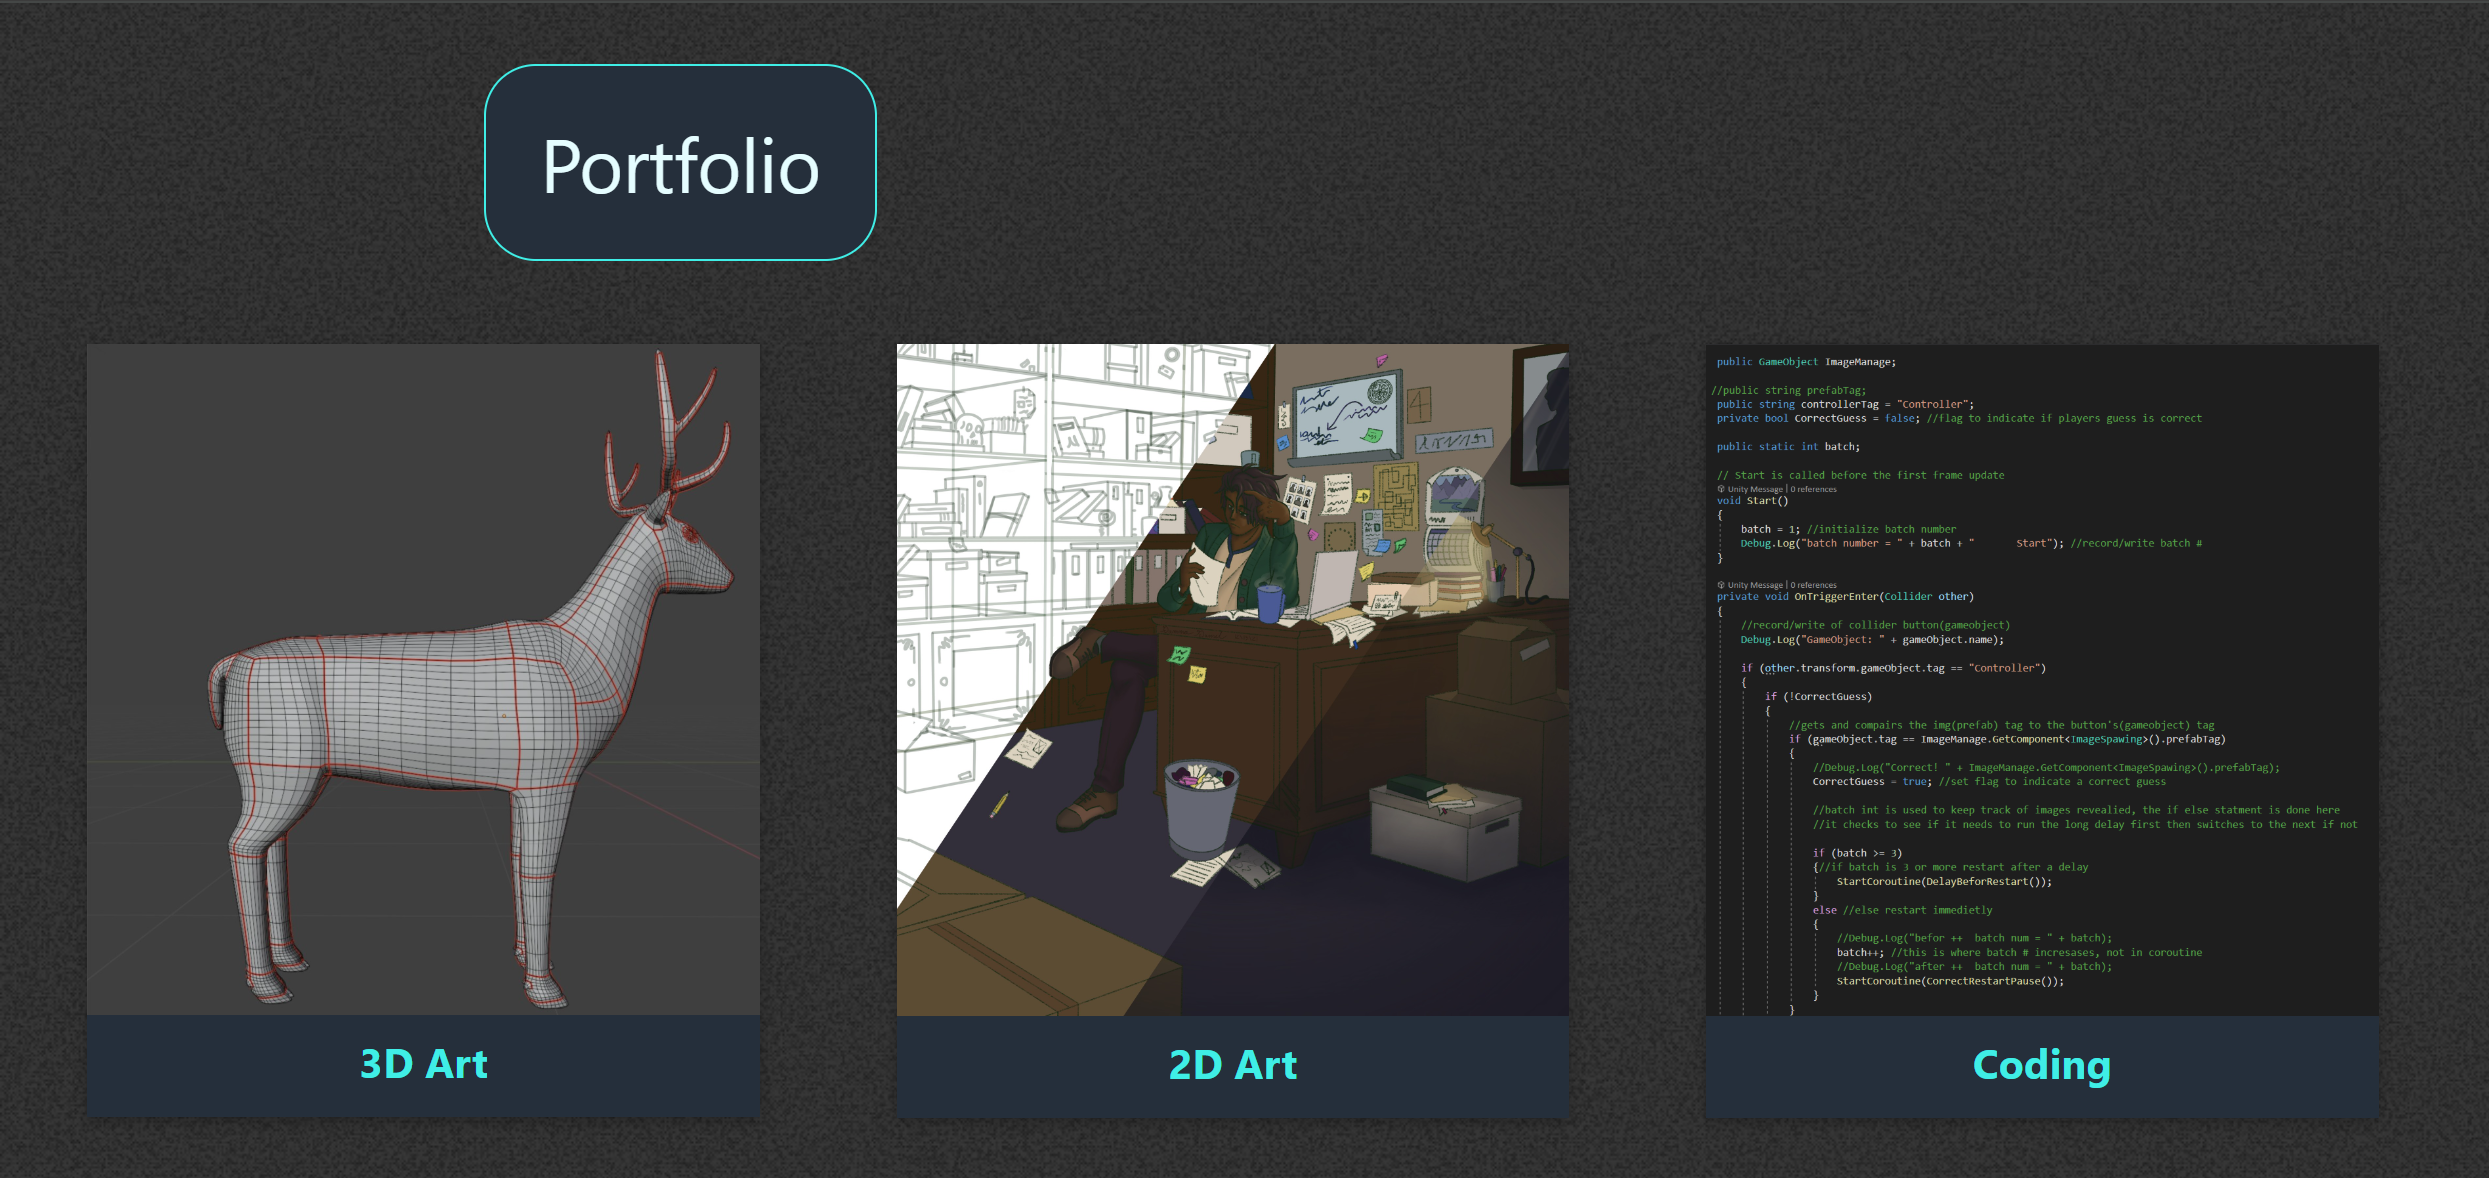
Fear Naut
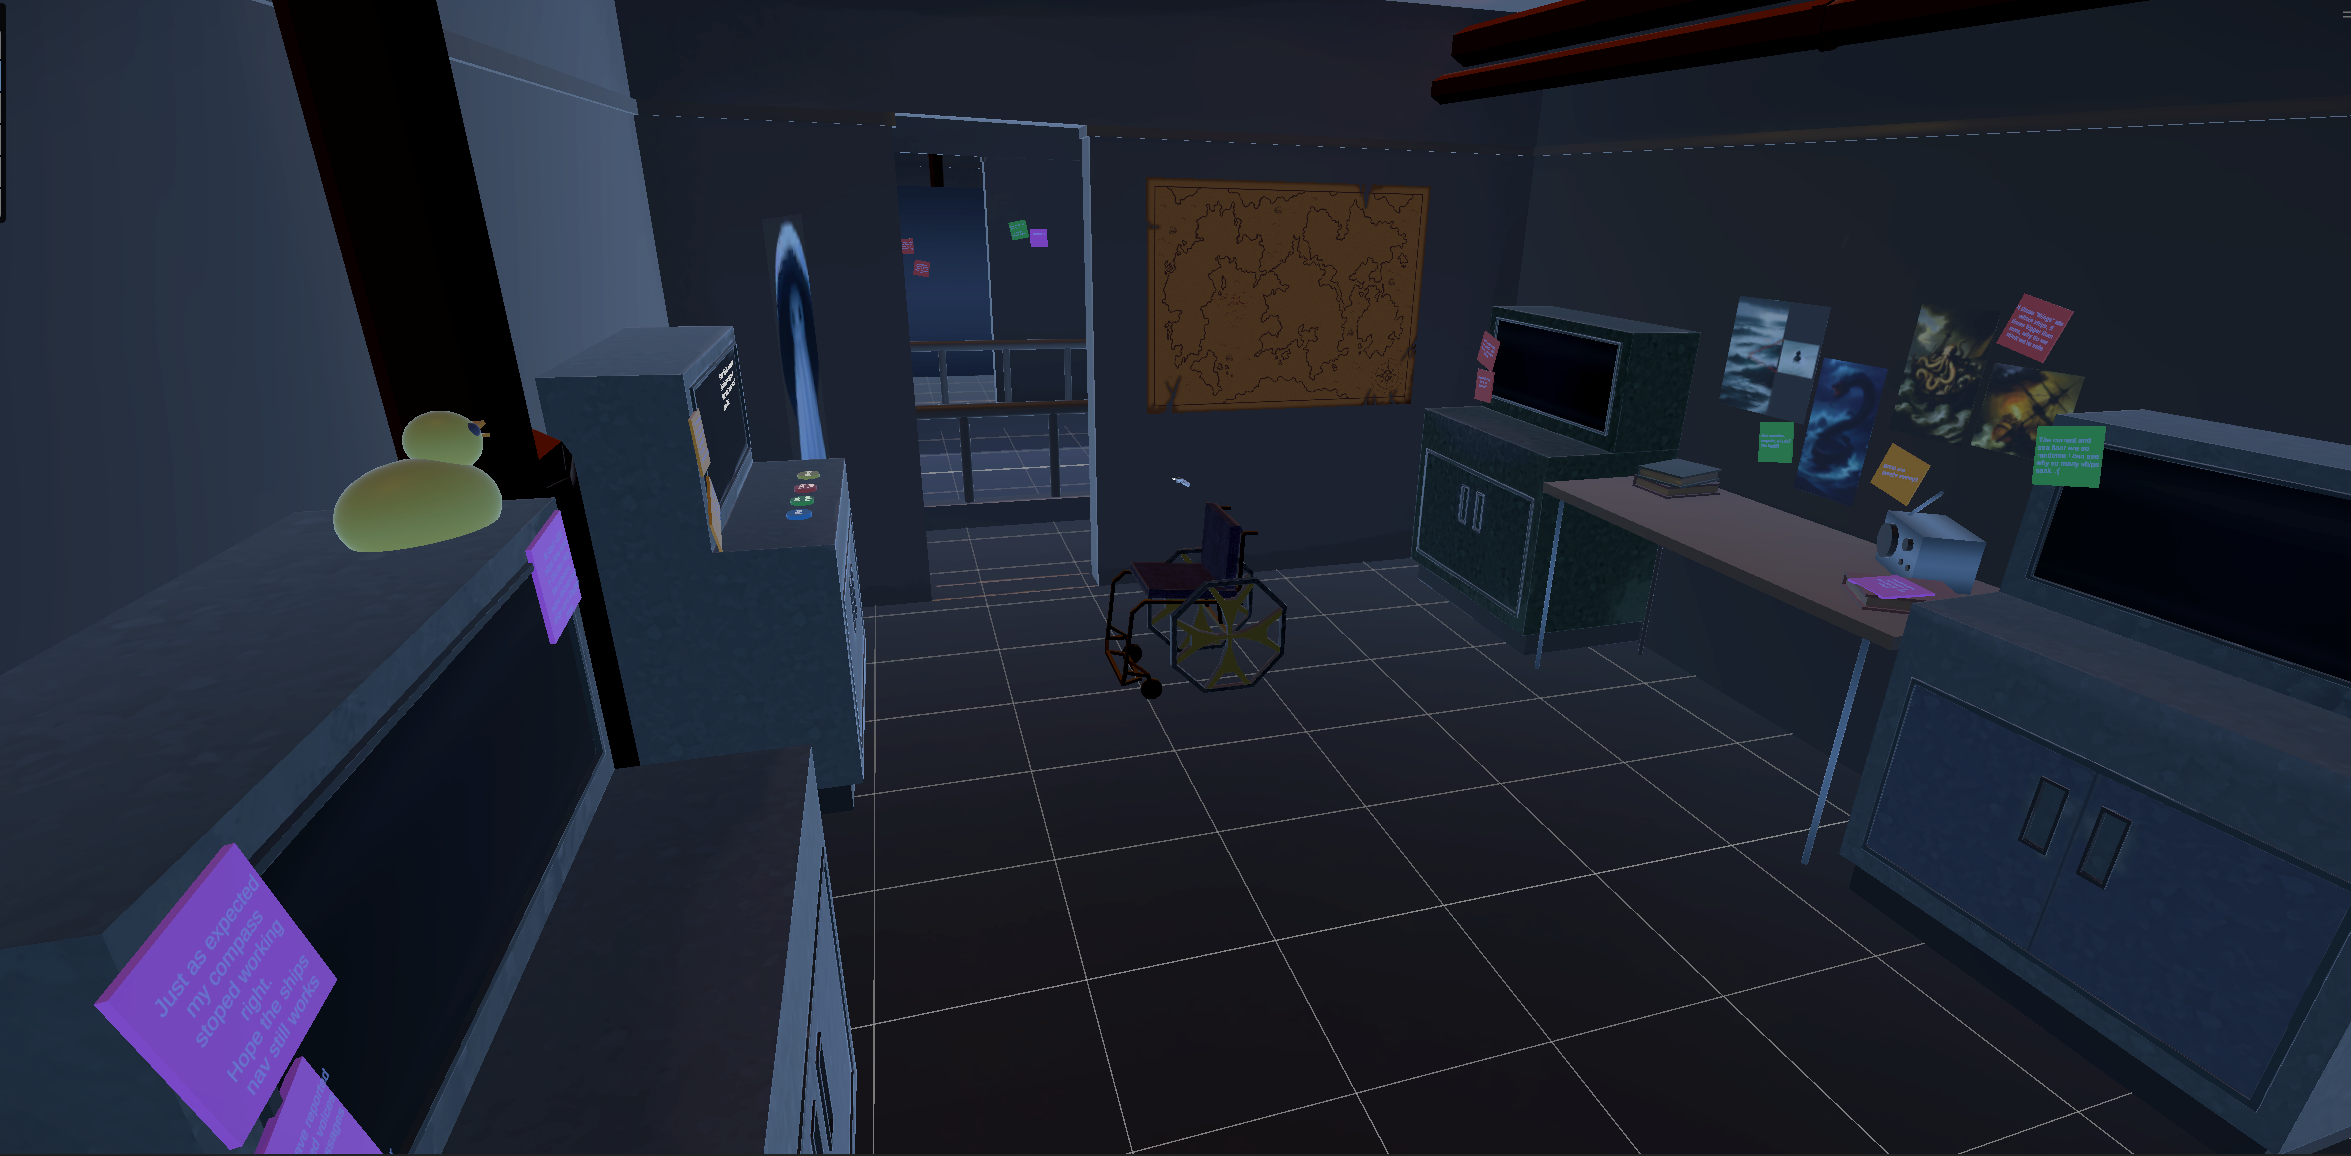
Main game play area
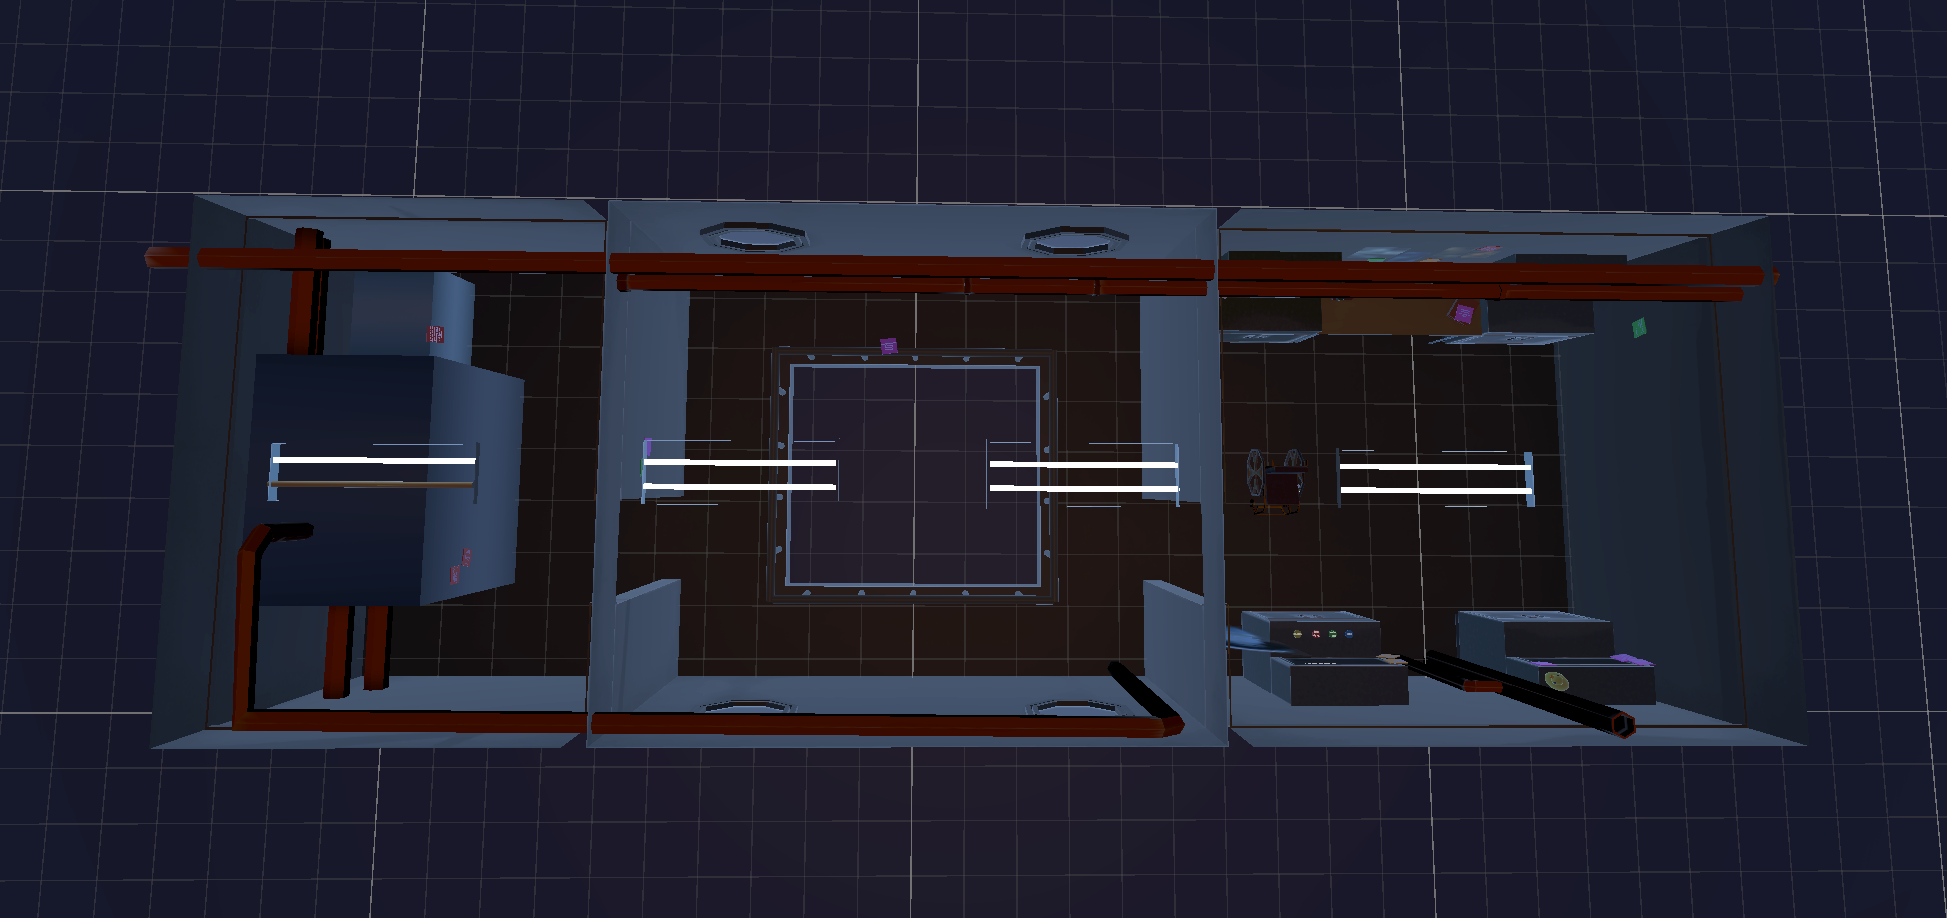
Main game play area topdown perspective
Software: Unity, Visual Studio Code
Fear Naut stands as an ongoing project in the realm of virtual reality (VR) horror gaming. Set within another world's equivalant of the Bermuda Triangle, Fear Naut places the wheel chair bound player aboard a research vessel embroiled in eerie mysteries.
In its current iteration, Fear Naut remains in the early stages of development, where eforts are devoted to crafting immersive gameplay experiences. The focus of development efforts lies in refining fundamental gameplay mechanics, shaping the atmospheric environment, and cultivating an eerie mood to captivate players.
The future developmental for Fear Naut encompasses a series of strategic milestones. Currently, the project prioritizes the refinement of core gameplay mechanics and refinment of the play space/setting. Following this, a second round of UX/UI testing will be administerd, with the results of this testing guiding future development.
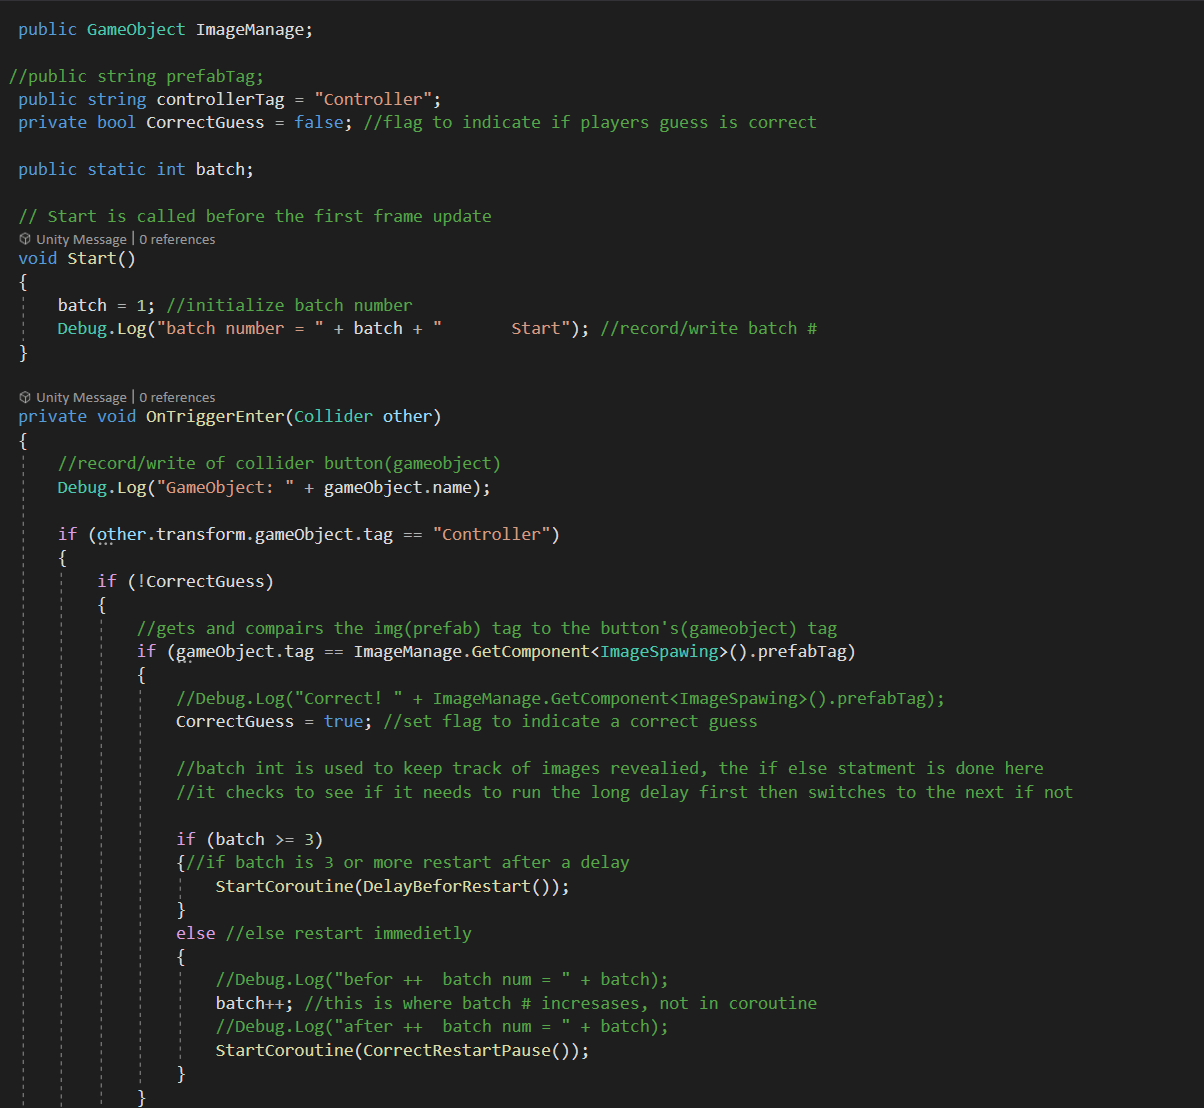
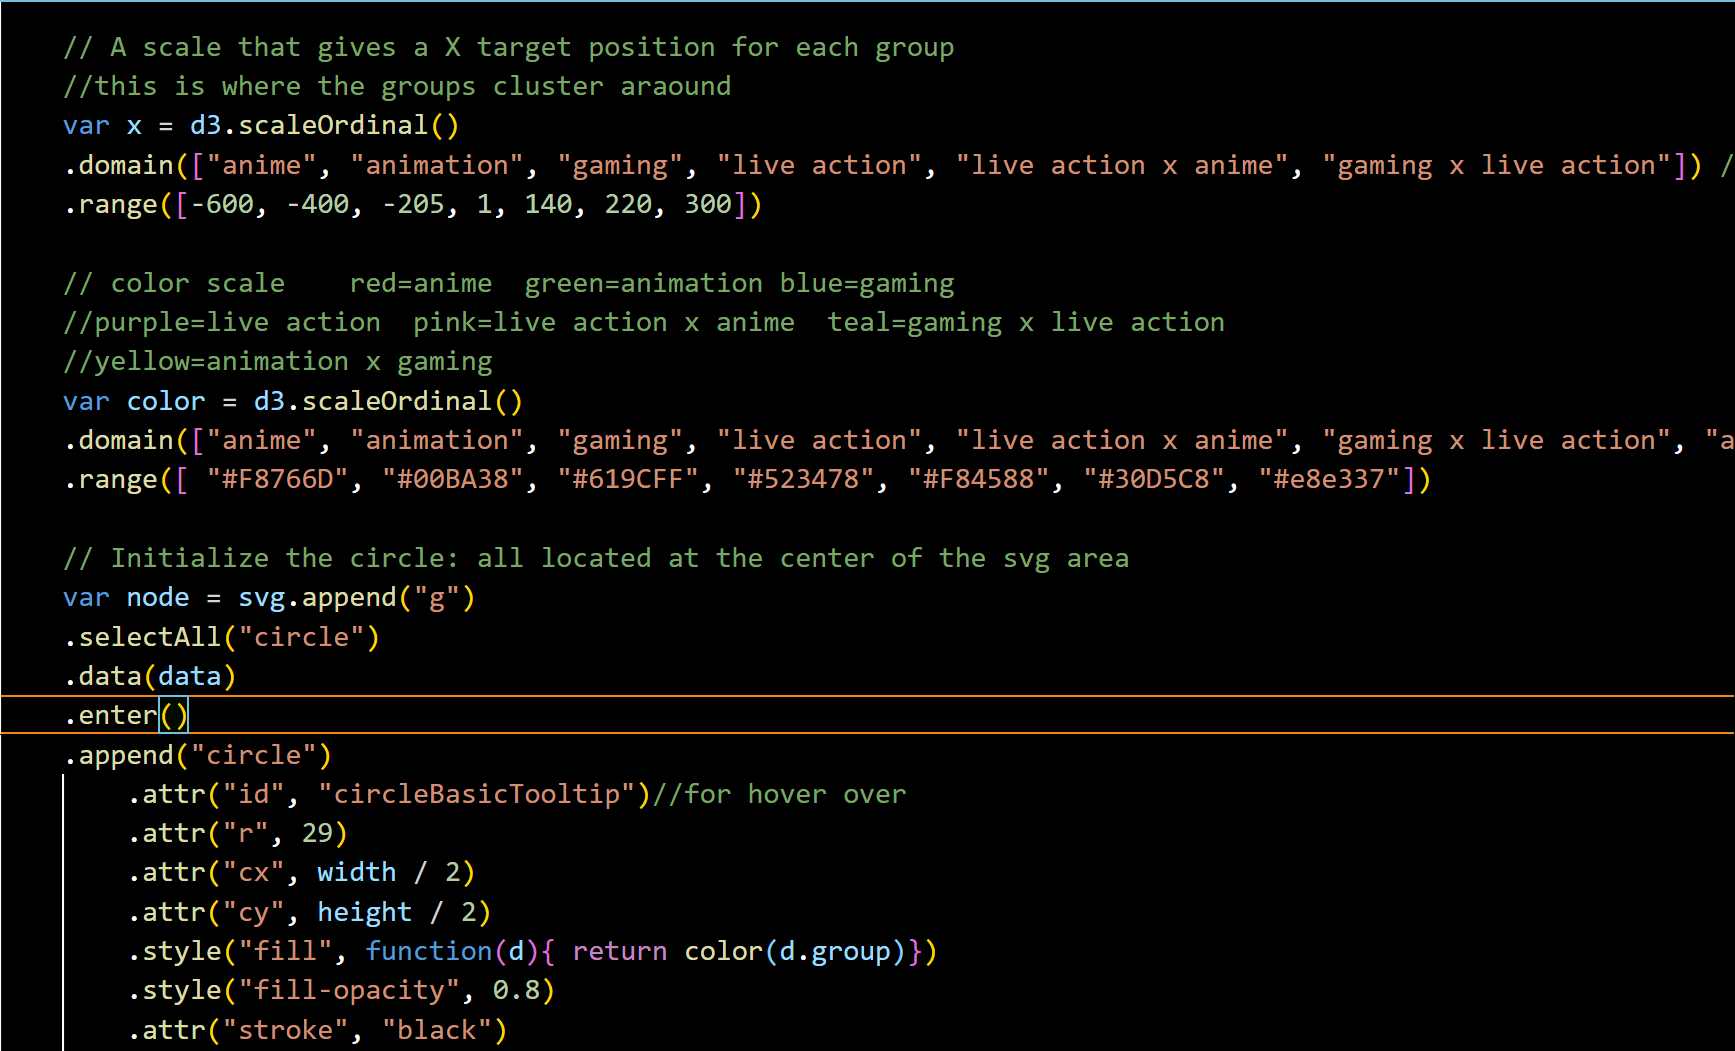
Image sorting code upper half
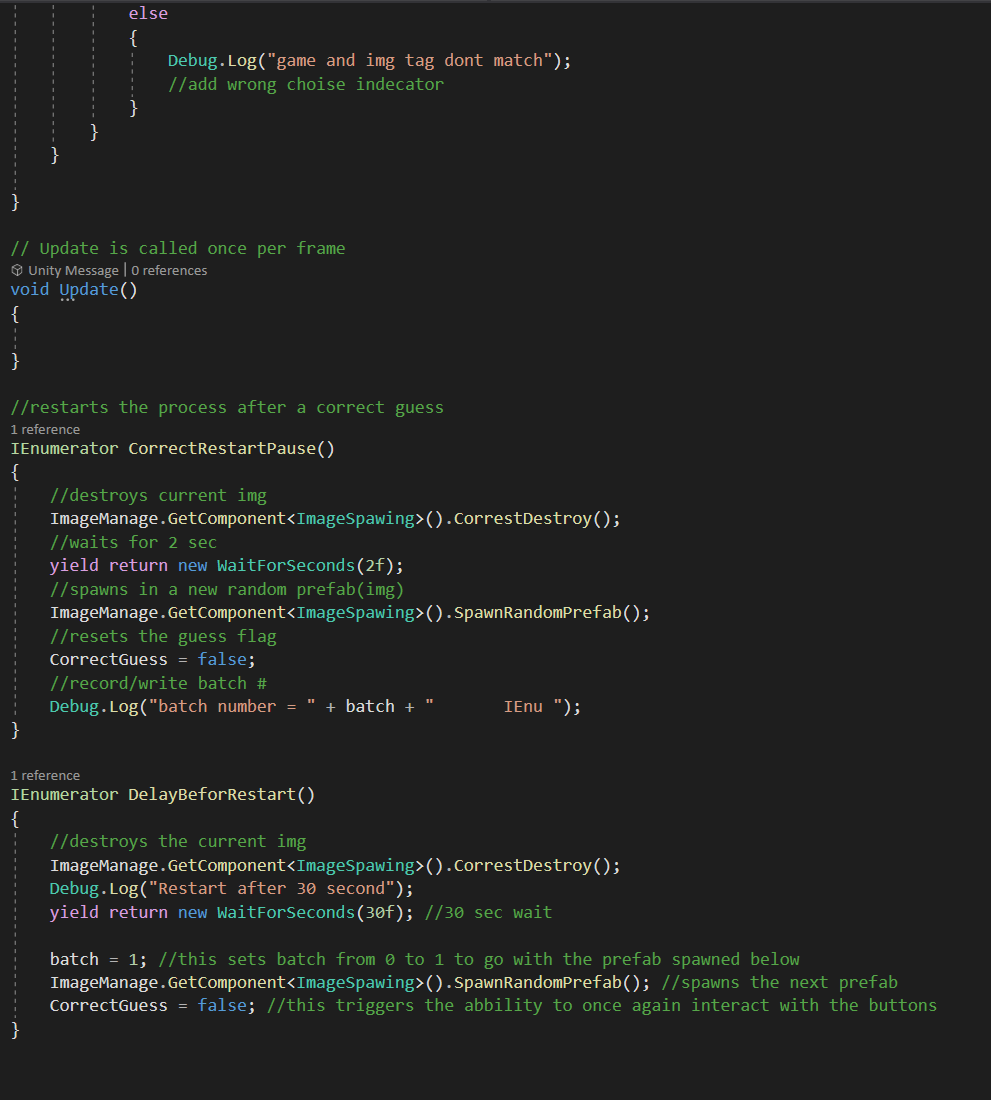
Image sorting code lower half
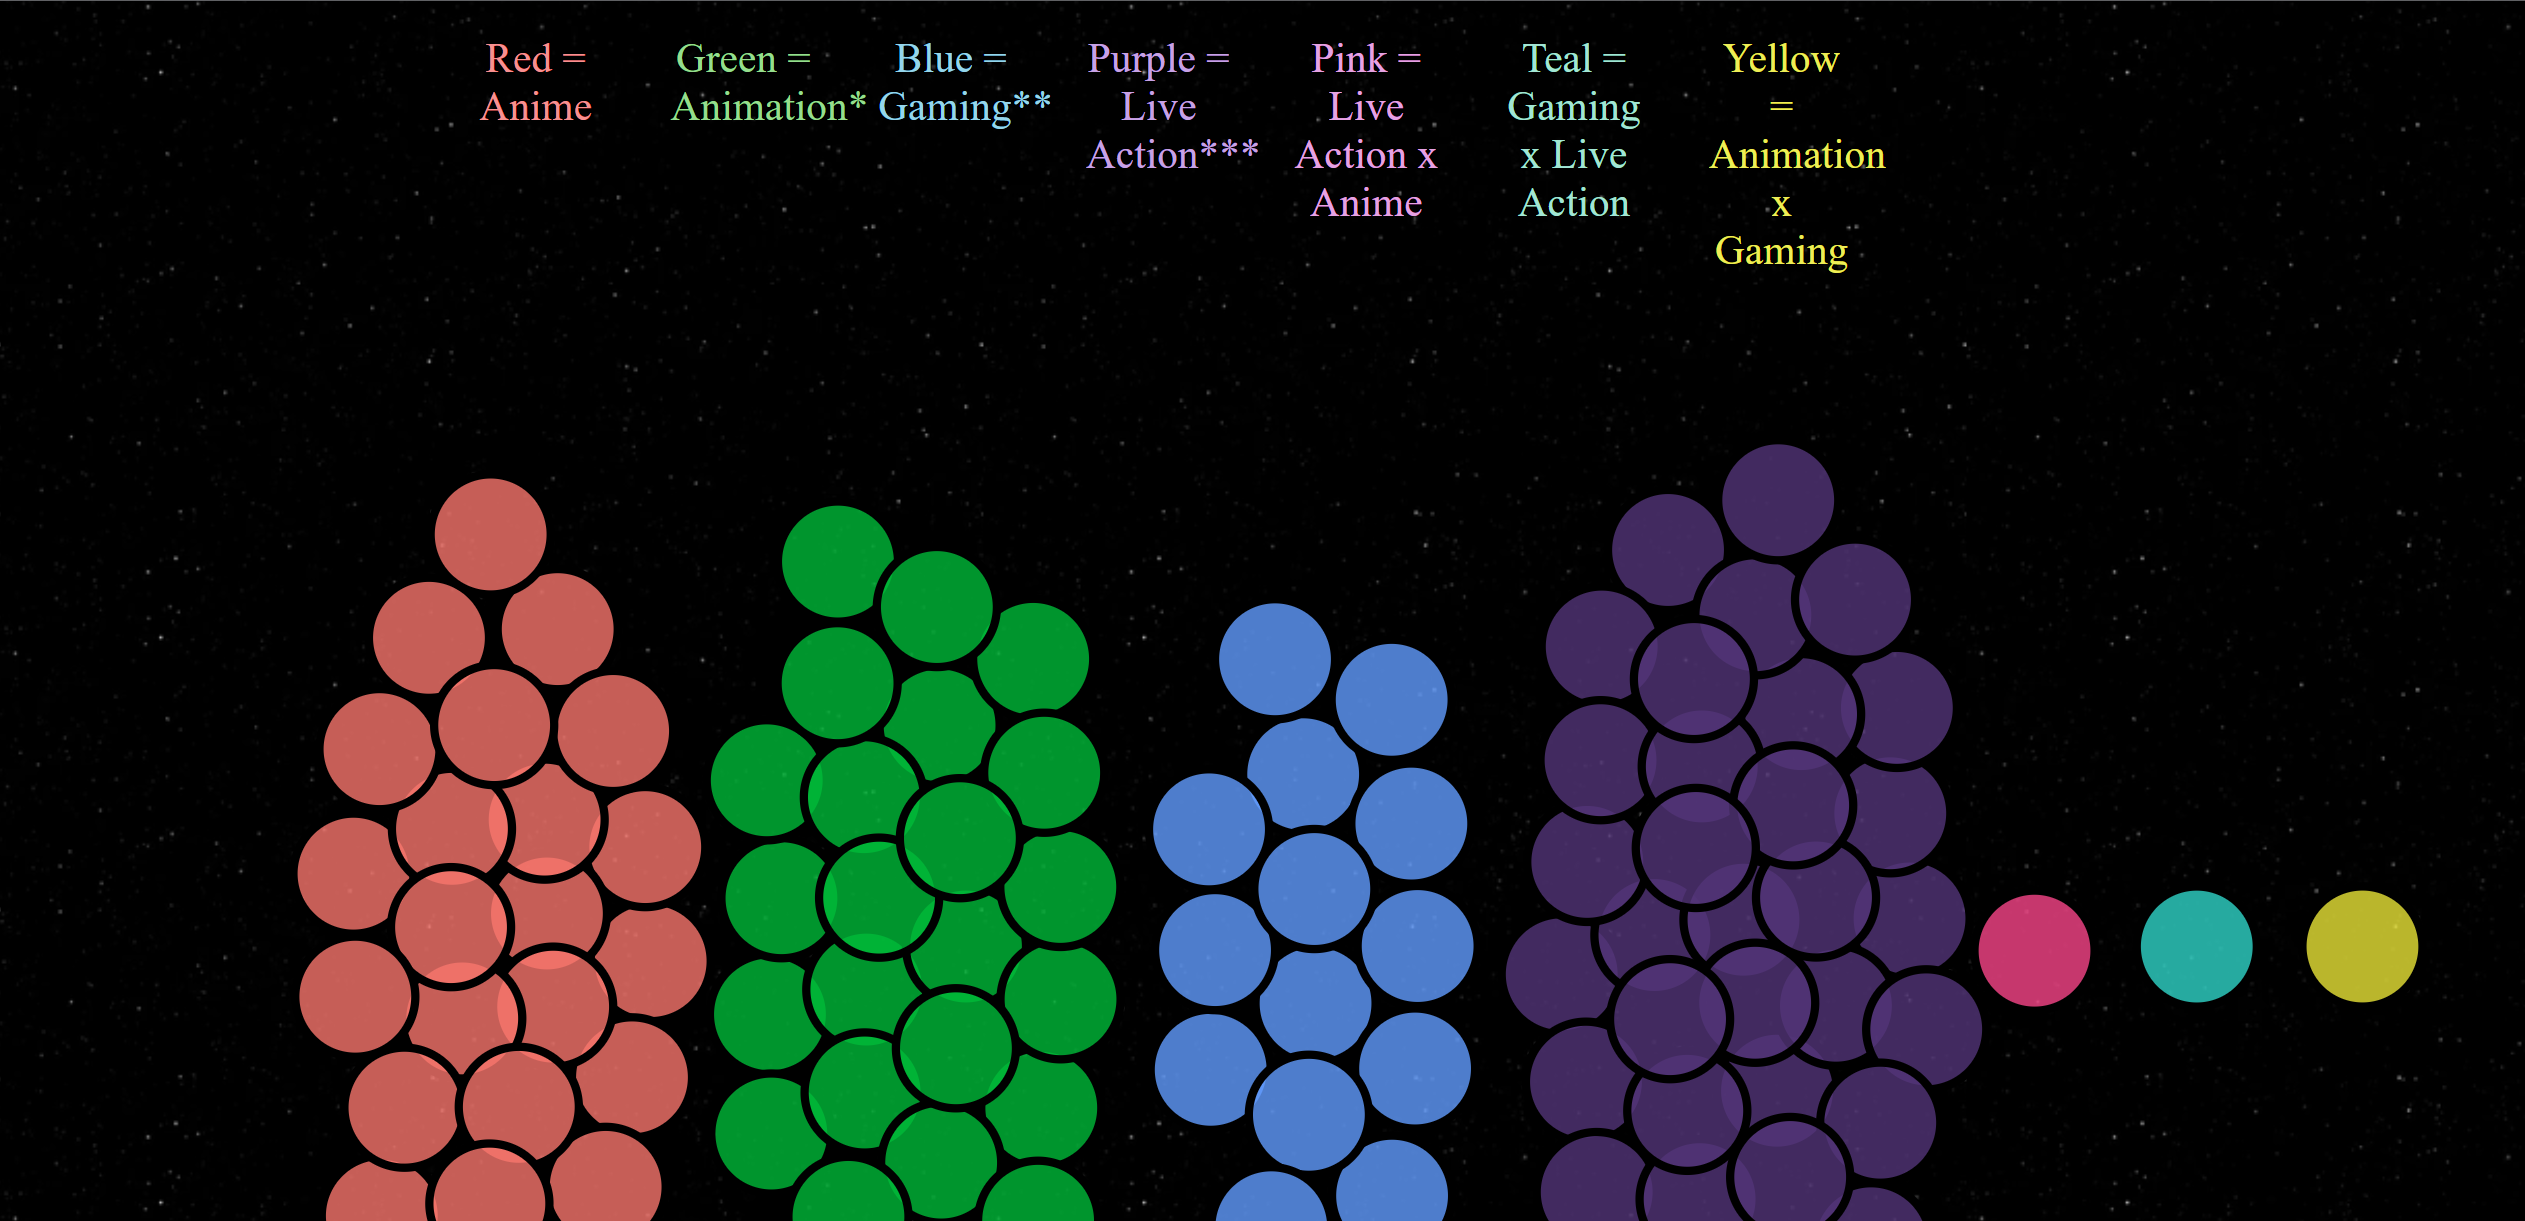
Above is some of the code responsible for the image sorting game loop in Fear Naut. In this loop, the player is presented with batches of random images, and they must sort them into different categories. Currently, this loop is in its most basic functional form-images spawn, and in-game buttons correspond to each one. When the correct button is pressed, the image despawns and a new one spawns in.
An initial struggle I had with setting this loop up was timing when image batches appeared, as well as ensuring the spawning and despawning occurred in a consistent manner. Upon discovering IEnumerator and coroutines, I created a much more consistent and effective process. I created two coroutines: one defining the spawning and despawning of images with the delays between the destruction and creation within a "batch." The second coroutine sets a longer delay before another batch of images appears, as well as resets the counter for how many batches have been displayed. I call the two coroutines using an if-else statement that is called when the player presses one of the in game buttons.